
 Digital Analytics Expert
 HTML, CSS & JS Lover
 Apps Script Developer
 Problem-Solving Oriented


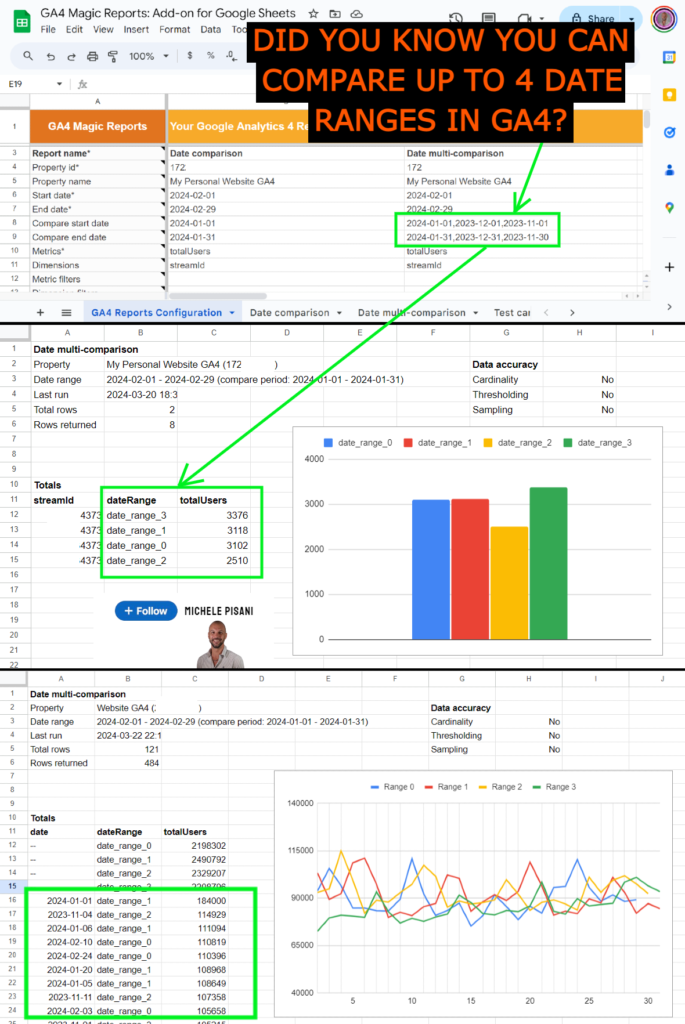
Although in the GA4 user interface it is possible to compare only data from one date range with data from another date range…
✨ I’ll tell you a TRICK to being able to compare 4 date ranges at the same time!
📊 You can get a report that compares, for example, your website or e-commerce performance week by week for an entire month, or individually compare 4 months of the current year or the previous year or the last quarters and so on.
All you need is a Google Sheet and my free GA4 Magic Reports add-on, which you can find here: https://workspace.google.com/marketplace/app/ga4_magic_reports/6532356327
What to do to compare up to 4 dates:
1️⃣ create a ‘New report‘ where you define the main date range to query (start date and end date)
2️⃣ once created, it will automatically appear in the Google Sheet
3️⃣ at this point, in the cell corresponding to the ‘Compare start date‘ row, enter 1, 2 or 3 start dates of the intervals you wish to export. You will need to enter them separated by commas, for example: 2024-01-01,2023-11-01,2023-10-01
4️⃣ with the same criteria, enter the corresponding interval end dates, for example: 2024-01-31,2023-11-30,2023-10-31
🏃♂️ run the report!
Date ranges will be named according to the corresponding zero-based index in the query: date_range_0, date_range_1, and so on.
Now you can play with the data within the Google Sheet to compare it through its graphs (see screenshot below) or import it into your data visualization systems!
Did you know this potential of GA4?
🤝 If you liked the post share it with your network and follow me for more tips and tricks!
Commenti recenti